

Sample Name:
Zone
Other
Date Issued:
07/07/2025
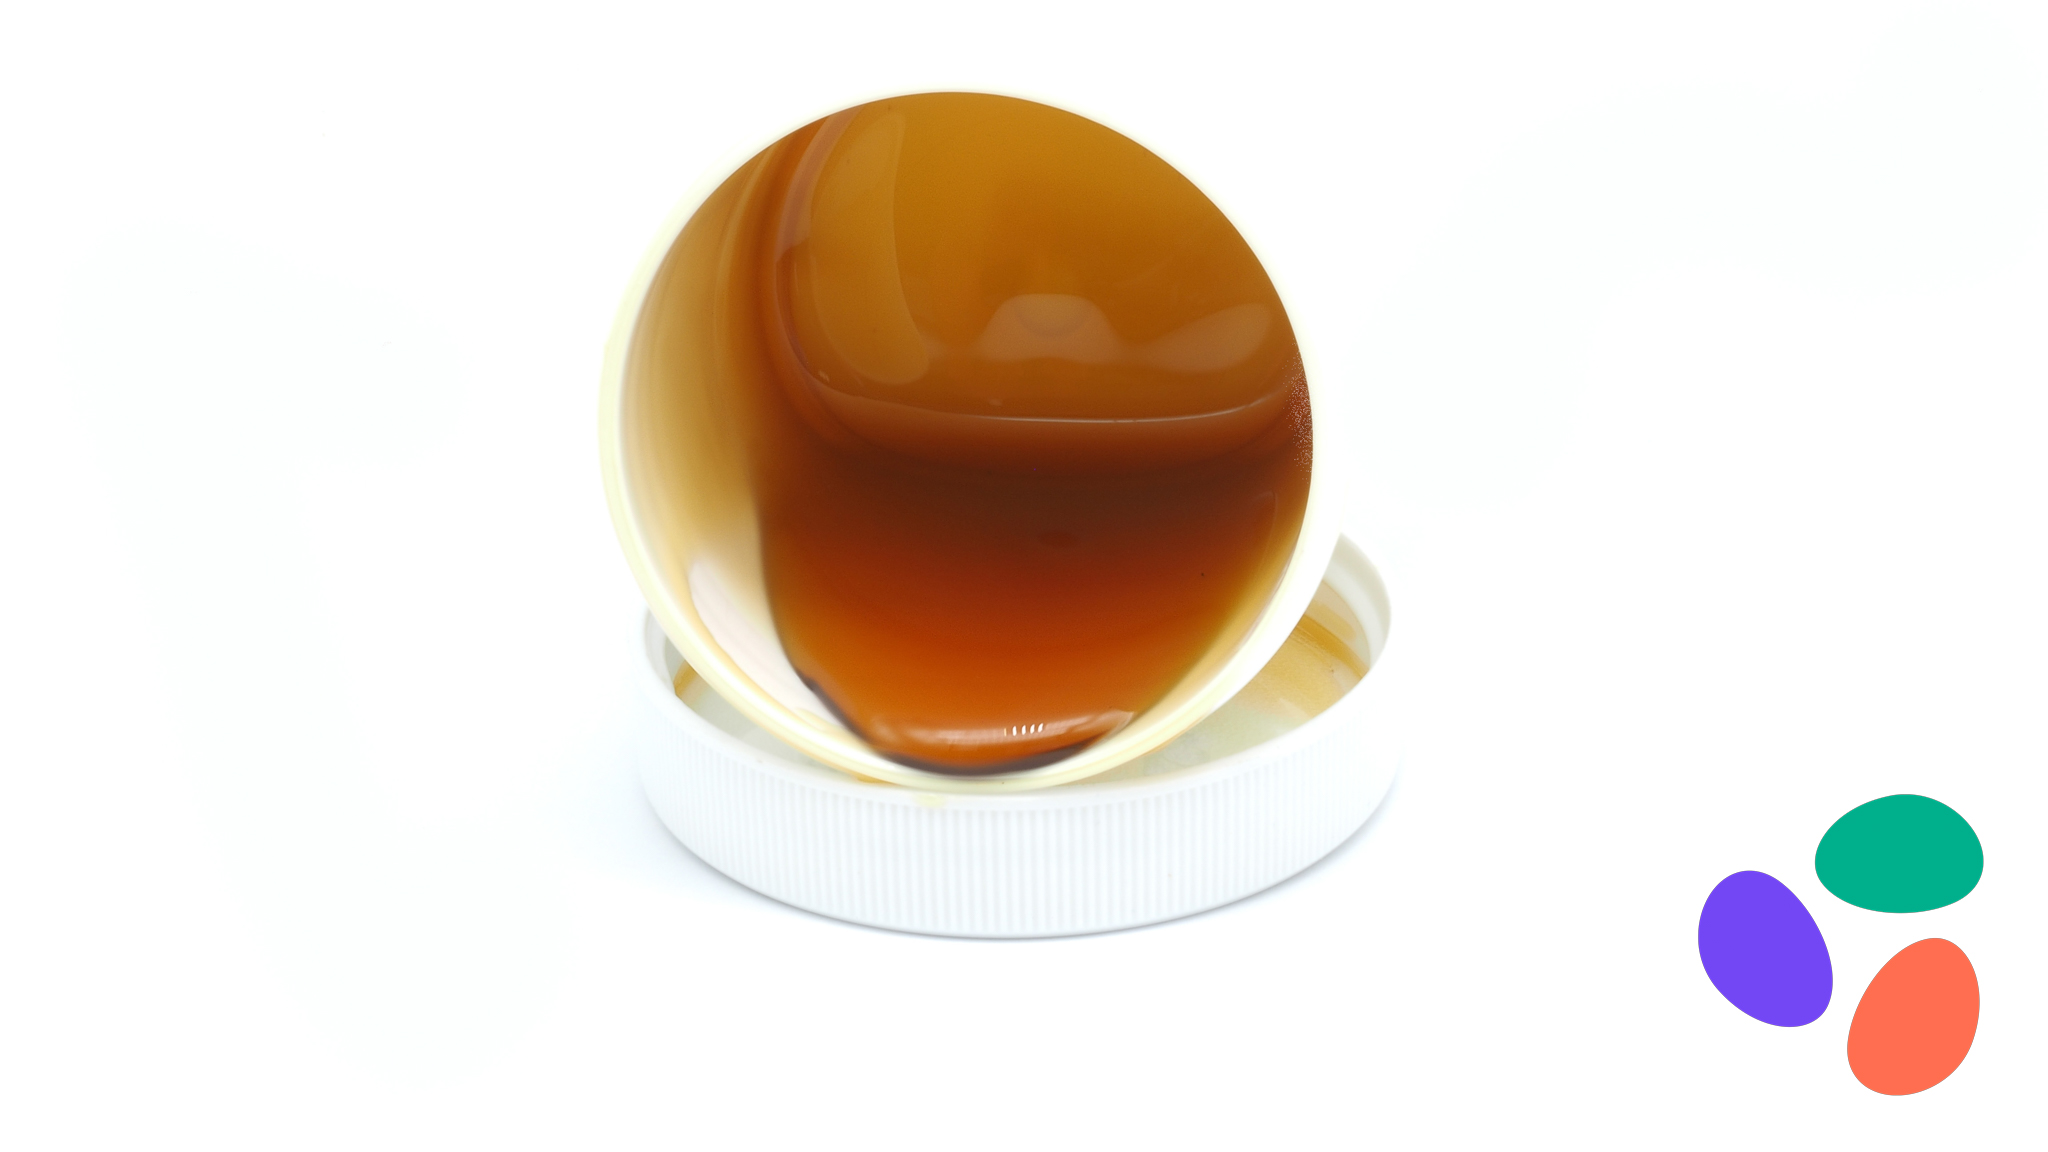
 Hover to Zoom In
Serving Size:
1 gram
- α-Bisabolol 2.7049%
- Limonene 1.6818%
- β-Pinene 0.8441%
Sample Information
Cultivator / Manufacturer
Distributor / Tested For
Share
Easily share a link to this results page with your friends, followers, or business partners.
Cannabinoid Analysis - Summary
Total THC: 2.355 mg/unit
Total CBD: 494.325 mg/unit
Sum of Cannabinoids: 603.867 mg/unit
Total Cannabinoids: 603.867 mg/unit
Total THC/CBD is calculated using the following formulas to take into account the loss of a carboxyl group during the decarboxylation step:
Total THC = Δ9-THC + (THCa (0.877))
Total CBD = CBD + (CBDa (0.877))
Sum of Cannabinoids = Δ9-THC + THCa + CBD + CBDa + CBG + CBGa + THCV + THCVa + CBC + CBCa + CBDV + CBDVa + Δ8-THC + CBL + CBN
Total Cannabinoids = (Δ9-THC+0.877*THCa) + (CBD+0.877*CBDa) + (CBG+0.877*CBGa) + (THCV+0.877*THCVa) + (CBC+0.877*CBCa) + (CBDV+0.877*CBDVa) + Δ8-THC + CBL + CBN

Sum of Cannabinoids: The concentration of each individual cannabinoid added together as they are, without accounting for decarboxylation. This measurement is of particular importance for certain cannabis products that are not intended to be heated prior to application or consumption.
Total Cannabinoids: The concentration of each acidic cannabinoid, multiplied by 0.877 to account for the loss of molecular mass that happens as it is converted to a neutral cannabinoid when heated. Then this calculated concentration is added to the concentrations of the corresponding neutral cannabinoid already present. This corrected data is of particular importance to both producers and consumers of products intended to be heated prior to application or consumption.
Total Terpenoids: 6.6166%
1
α-Bisabolol (2.7049%)
2
Limonene (1.6818%)
3
β-Pinene (0.8441%)
Safety Analysis - Summary
Pesticides: Pass
Heavy Metals: Pass
Microbiology (PCR): Pass
View Complete Test Results:

Cannabinoid Analysis
Tested
Show More
Tested by high-performance liquid chromatography with diode-array detection (HPLC-DAD).
Method: QSP 1157 - Analysis of Cannabinoids by HPLC-DAD
Cannabinoid Test Results
07/06/2025
Result Views
Swipe left on table to see additional columns
| Compound |
LOD/LOQ (mg/g) |
Measurement Uncertainty (mg/g) |
Result (mg/g) |
Result (%) |
|---|---|---|---|---|
| Cannabidiol (CBD) | 0.004 / 0.011 | ±18.4383 | 494.325 | 49.4325 |
| Cannabigerol (CBG) | 0.002 / 0.006 | ±2.8973 | 59.738 | 5.9738 |
| Cannabichromene (CBC) | 0.003 / 0.010 | ±0.8177 | 25.394 | 2.5394 |
| Cannabinol (CBN) | 0.001 / 0.007 | ±0.3868 | 13.478 | 1.3478 |
| Cannabidivarin (CBDV) | 0.002 / 0.012 | ±0.1998 | 4.897 | 0.4897 |
| Cannabicyclol (CBL) | 0.003 / 0.010 | ±0.1358 | 3.680 | 0.3680 |
| Δ9 Tetrahydrocannabinol (Δ9THC) | 0.002 / 0.014 | ±0.1293 | 2.355 | 0.2355 |
| Cannabichromenic Acid (CBCa) | 0.001 / 0.015 | N/A | ND | ND |
| Cannabidiolic Acid (CBDa) | 0.001 / 0.026 | N/A | ND | ND |
| Cannabigerolic Acid (CBGa) | 0.002 / 0.007 | N/A | ND | ND |
| Tetrahydrocannabivarin (THCV) | 0.002 / 0.012 | N/A | ND | ND |
| Tetrahydrocannabinolic Acid (THCa) | 0.001 / 0.005 | N/A | ND | ND |
| Cannabidivarinic Acid (CBDVa) | 0.001 / 0.018 | N/A | ND | ND |
| Tetrahydrocannabivarinic Acid (THCVa) | 0.002 / 0.019 | N/A | ND | ND |
| ∆8 Tetrahydrocannabinol (Δ8THC) | 0.01 / 0.02 | N/A | ND | ND |
| SUM OF CANNABINOIDS | 603.867 mg/g | 60.3867% |
Unit Mass:
1 gram
/
Serving Size:
1 gram
Swipe left on table to see additional columns
| Δ9-THC per Unit | 2.355 mg/unit | ||
| Δ9-THC per Serving | 2.355 mg/serving | ||
| Total THC per Unit | 2.355 mg/unit | ||
| Total THC Per Serving | 2.355 mg/serving | ||
| CBD per Unit | 494.325 mg/unit | ||
| CBD per Serving | 494.325 mg/serving | ||
| Total CBD per Unit | 494.325 mg/unit | ||
| Total CBD per Serving | 494.325 mg/serving | ||
| Sum of Cannabinoids per Unit | 603.867 mg/unit | ||
| Sum of Cannabinoids per Serving | 603.867 mg/serving | ||
| Total Cannabinoids per Unit | 603.867 mg/unit | ||
| Total Cannabinoids per Serving | 603.867 mg/serving |
Learn more
The cannabis plant contains dozens of active compounds called cannabinoids. These compounds are the primary contributors to the psychoactive effects of cannabis.
Cannabinoid testing determines the potency of a sample to aid in dosage considerations.

Terpenoid Analysis
Tested
Show More
Terpene analysis utilizing gas chromatography-flame ionization detection (GC-FID).
Method: QSP 1192 - Analysis of Terpenoids by GC-FID
Terpenoid Test Results
07/06/2025
Result Views
Swipe left on table to see additional columns
| Compound |
LOD/LOQ (mg/g) |
Measurement Uncertainty (mg/g) |
Result (mg/g) |
Result (%) |
|---|---|---|---|---|
| α-Bisabolol | 0.008 / 0.026 | ±1.1225 | 27.049 | 2.7049 |
| Limonene | 0.005 / 0.036 | ±0.1867 | 16.818 | 1.6818 |
| β-Pinene | 0.004 / 0.014 | ±0.0751 | 8.441 | 0.8441 |
| α-Pinene | 0.005 / 0.036 | ±0.0559 | 8.340 | 0.8340 |
| β-Caryophyllene | 0.004 / 0.012 | ±0.0465 | 1.677 | 0.1677 |
| α-Humulene | 0.009 / 0.180 | ±0.0285 | 1.138 | 0.1138 |
| Nerolidol | 0.006 / 0.021 | ±0.0427 | 0.872 | 0.0872 |
| Caryophyllene Oxide | 0.010 / 0.033 | ±0.0229 | 0.640 | 0.0640 |
| Myrcene | 0.008 / 0.025 | ±0.0038 | 0.384 | 0.0384 |
| Terpineol | 0.009 / 0.031 | ±0.0111 | 0.232 | 0.0232 |
| Linalool | 0.009 / 0.036 | ±0.0050 | 0.170 | 0.0170 |
| Δ3-Carene | 0.005 / 0.018 | ±0.0010 | 0.094 | 0.0094 |
| Borneol | 0.005 / 0.016 | ±0.0023 | 0.071 | 0.0071 |
| Camphene | 0.005 / 0.015 | ±0.0006 | 0.067 | 0.0067 |
| γ-Terpinene | 0.006 / 0.018 | ±0.0008 | 0.057 | 0.0057 |
| Terpinolene | 0.008 / 0.036 | ±0.0008 | 0.052 | 0.0052 |
| Fenchol | 0.010 / 0.036 | ±0.0014 | 0.047 | 0.0047 |
| p-Cymene | 0.005 / 0.016 | ±0.0004 | 0.017 | 0.0017 |
| Nerol | 0.003 / 0.036 | N/A | <LOQ | <LOQ |
| Menthol | 0.008 / 0.025 | N/A | <LOQ | <LOQ |
| Fenchone | 0.009 / 0.036 | N/A | <LOQ | <LOQ |
| Citronellol | 0.003 / 0.036 | N/A | <LOQ | <LOQ |
| α-Terpinene | 0.005 / 0.017 | N/A | <LOQ | <LOQ |
| Cedrol | 0.008 / 0.027 | N/A | ND | ND |
| Guaiol | 0.009 / 0.030 | N/A | ND | ND |
| Camphor | 0.006 / 0.036 | N/A | ND | ND |
| Geraniol | 0.002 / 0.036 | N/A | ND | ND |
| Pulegone | 0.003 / 0.011 | N/A | ND | ND |
| Sabinene | 0.004 / 0.014 | N/A | ND | ND |
| Valencene | 0.009 / 0.180 | N/A | ND | ND |
| Eucalyptol | 0.006 / 0.018 | N/A | ND | ND |
| Isoborneol | 0.004 / 0.012 | N/A | ND | ND |
| Isopulegol | 0.005 / 0.036 | N/A | ND | ND |
| β-Ocimene | 0.006 / 0.025 | N/A | ND | ND |
| α-Cedrene | 0.005 / 0.016 | N/A | ND | ND |
| Geranyl Acetate | 0.004 / 0.036 | N/A | ND | ND |
| Sabinene Hydrate | 0.006 / 0.036 | N/A | ND | ND |
| α-Phellandrene | 0.006 / 0.036 | N/A | ND | ND |
| trans-β-Farnesene | 0.008 / 0.025 | N/A | ND | ND |
| TOTAL | 66.166 mg/g | 6.6166% |
Learn more
Terpenoid analysis is crucial for differentiating between strains of cannabis, as terpenoids have a major influence on the medical and psychological effects of a plant. The relationship between cannabinoids and terpeneoids is known as the "entourage effect."

Pesticide Analysis
Pass
Show More
Pesticide and plant growth regulator analysis utilizing high-performance liquid chromatography-mass spectrometry (HPLC-MS) or gas chromatography-mass spectrometry (GC-MS).
*GC-MS utilized where indicated.
Method: QSP 1212 - Analysis of Pesticides and Mycotoxins by LC-MS or QSP 1213 - Analysis of Pesticides by GC-MS
Pesticide Test Results
07/07/2025
PASS
Swipe left on table to see additional columns
| Compound |
LOD/LOQ (μg/g) |
Action Limit (μg/g) |
Measurement Uncertainty (μg/g) |
Result (μg/g) |
Result |
|---|---|---|---|---|---|
| Abamectin | 0.03 / 0.10 | 0.3 | N/A | ND | Pass |
| Azoxystrobin | 0.02 / 0.07 | 40 | N/A | ND | Pass |
| Bifenazate | 0.01 / 0.04 | 5 | N/A | ND | Pass |
| Bifenthrin | 0.02 / 0.05 | 0.5 | N/A | <LOQ | Pass |
| Boscalid | 0.03 / 0.09 | 10 | N/A | ND | Pass |
| Chlorpyrifos | 0.02 / 0.06 | ≥ LOD | N/A | ND | Pass |
| Cypermethrin | 0.11 / 0.32 | 1 | N/A | ND | Pass |
| Etoxazole | 0.02 / 0.06 | 1.5 | N/A | ND | Pass |
| Hexythiazox | 0.02 / 0.07 | 2 | N/A | ND | Pass |
| Imidacloprid | 0.04 / 0.11 | 3 | N/A | ND | Pass |
| Malathion | 0.03 / 0.09 | 5 | N/A | ND | Pass |
| Myclobutanil | 0.03 / 0.09 | 9 | N/A | ND | Pass |
| Permethrin | 0.04 / 0.12 | 20 | N/A | ND | Pass |
| Piperonyl Butoxide | 0.02 / 0.07 | 8 | N/A | <LOQ | Pass |
| Propiconazole | 0.02 / 0.07 | 20 | N/A | ND | Pass |
| Spiromesifen | 0.02 / 0.05 | 12 | N/A | ND | Pass |
| Tebuconazole | 0.02 / 0.07 | 2 | N/A | ND | Pass |
| Trifloxystrobin | 0.03 / 0.08 | 30 | N/A | ND | Pass |

Heavy Metals Analysis
Pass
Show More
Heavy metal analysis utilizing inductively coupled plasma-mass spectrometry (ICP-MS).
Method: QSP 1160 - Analysis of Heavy Metals by ICP-MS
Heavy Metals Test Results
07/06/2025
PASS
Swipe left on table to see additional columns
| Compound |
LOD/LOQ (μg/g) |
Action Limit (μg/g) |
Measurement Uncertainty (μg/g) |
Result (μg/g) |
Result |
|---|---|---|---|---|---|
| Arsenic | 0.02 / 0.1 | 1.5 | N/A | ND | Pass |
| Cadmium | 0.02 / 0.05 | 0.5 | N/A | ND | Pass |
| Lead | 0.04 / 0.1 | 0.5 | N/A | ND | Pass |
| Mercury | 0.002 / 0.01 | 3 | N/A | ND | Pass |

Microbiology Analysis
Pass
Show More
Analysis conducted by polymerase chain reaction (PCR) and fluorescence detection of microbiological contaminants.
Method: QSP 1221 - Analysis of Microbiological Contaminants
Microbiology Test Results (PCR)
07/07/2025
PASS
Swipe left on table to see additional columns
| Compound | Action Limit | Result | Result |
|---|---|---|---|
| Salmonella spp. | Not Detected in 1g | ND | Pass |
| Shiga toxin-producing Escherichia coli | Not Detected in 1g | ND | Pass |
Notes
Show More
COA Notes:
Sample serving mass provided by client. Sample unit mass provided by client.
COA ID: 250705R003-001
These results relate only to the sample included on this report. This report shall not be reproduced, except in full, without written approval of the laboratory.
Sample Certification: California Code of Regulations Title 4 Division 19. Department of Cannabis Control Business and Professions Code. Reference: Sections 26100, 26104 and 26110, Business and Professions Code.
Decision Rule: Statements of conformity (e.g. Pass/Fail) to specifications are made in this report without taking measurement uncertainty into account. Where statements of conformity are made in this report, the following decision rules are applied: PASS - Results within limits/specifications, FAIL - Results exceed limits/specifications.
References: limit of detection (LOD), limit of quantification (LOQ), not detected (ND), not tested (NT), μg/g = ppm, μg/kg = ppb
SC Laboratories California LLC. | 100 Pioneer Street, Suite E, Santa Cruz, CA 95060 | (866) 435-0709 | sclabs.com | C8-0000013-LIC | ISO/IES 17025:2017 PJLA Accreditation Number 87168